Detection across six departures
Original signal settings and the selected weaker signal settings, shown separately on the same color scale.
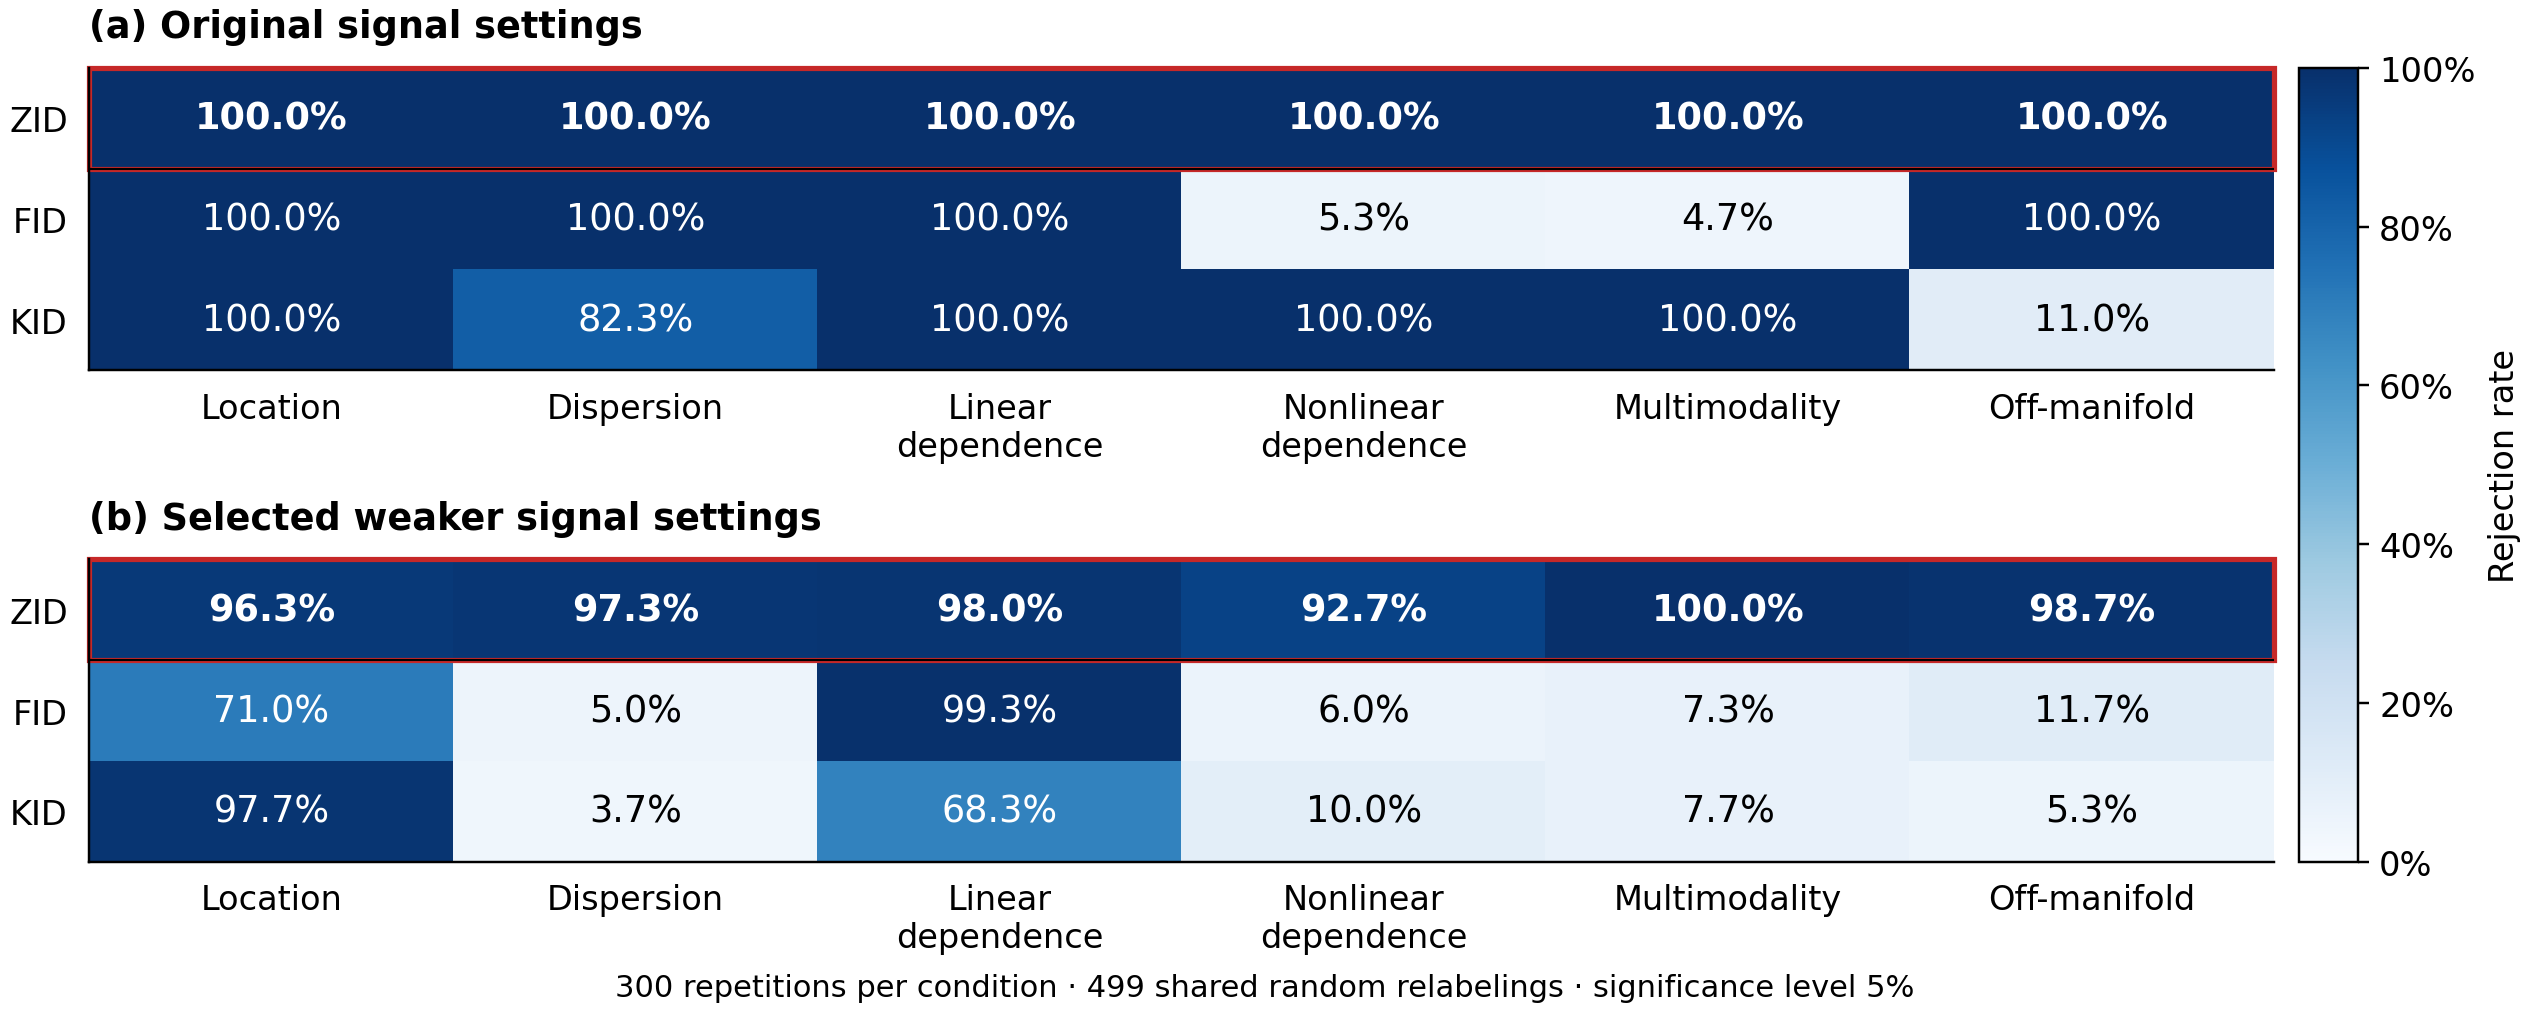
Each cell reports the percentage of rejections over 300 repetitions, with 10,000 samples per group, 499 shared random relabelings, and a significance level of 5%. The boxed row is the standard six-arm ZID test. No error bars are shown.
Signed dispersion diagnosis
The signed ZID dispersion readout and FID under contraction and expansion.
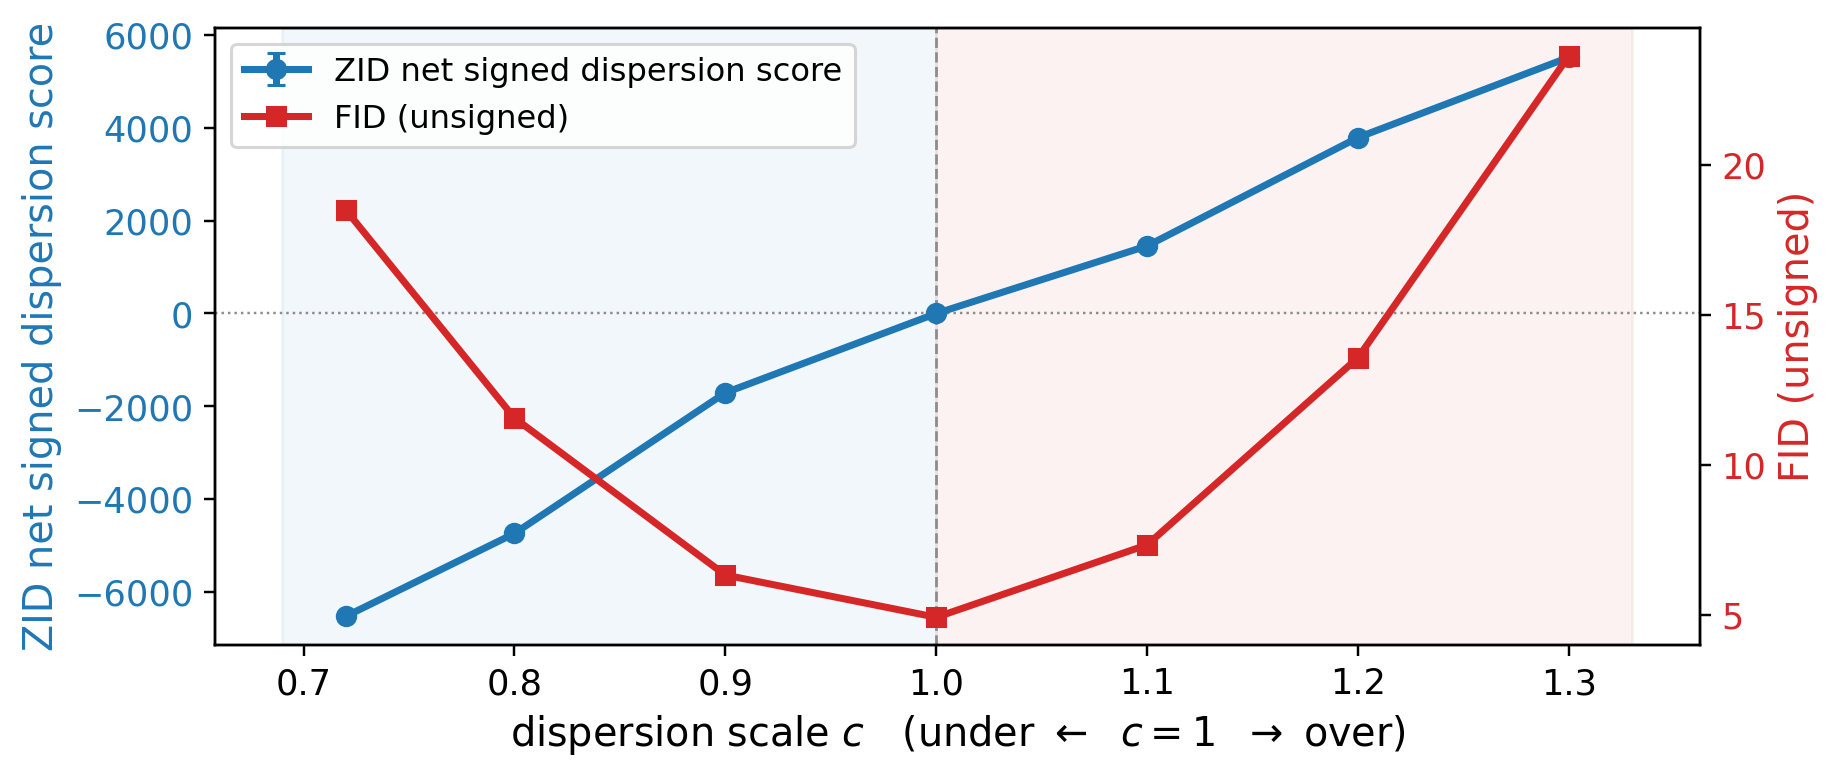
Points show means across eight repetitions, with 10,000 samples per group. Blue error bars show the standard deviation of the signed scores across those repetitions. The scale c contracts candidate deviations when c < 1 and expands them when c > 1.
The ZID curve is the ungated net signed dispersion score, not the overall ZID score or a significance-qualified direction call. The two curves use separate vertical axes.
Ranking increasing perturbation severity
Original and weaker severity settings, evaluated using metric scores rather than permutation rejections.
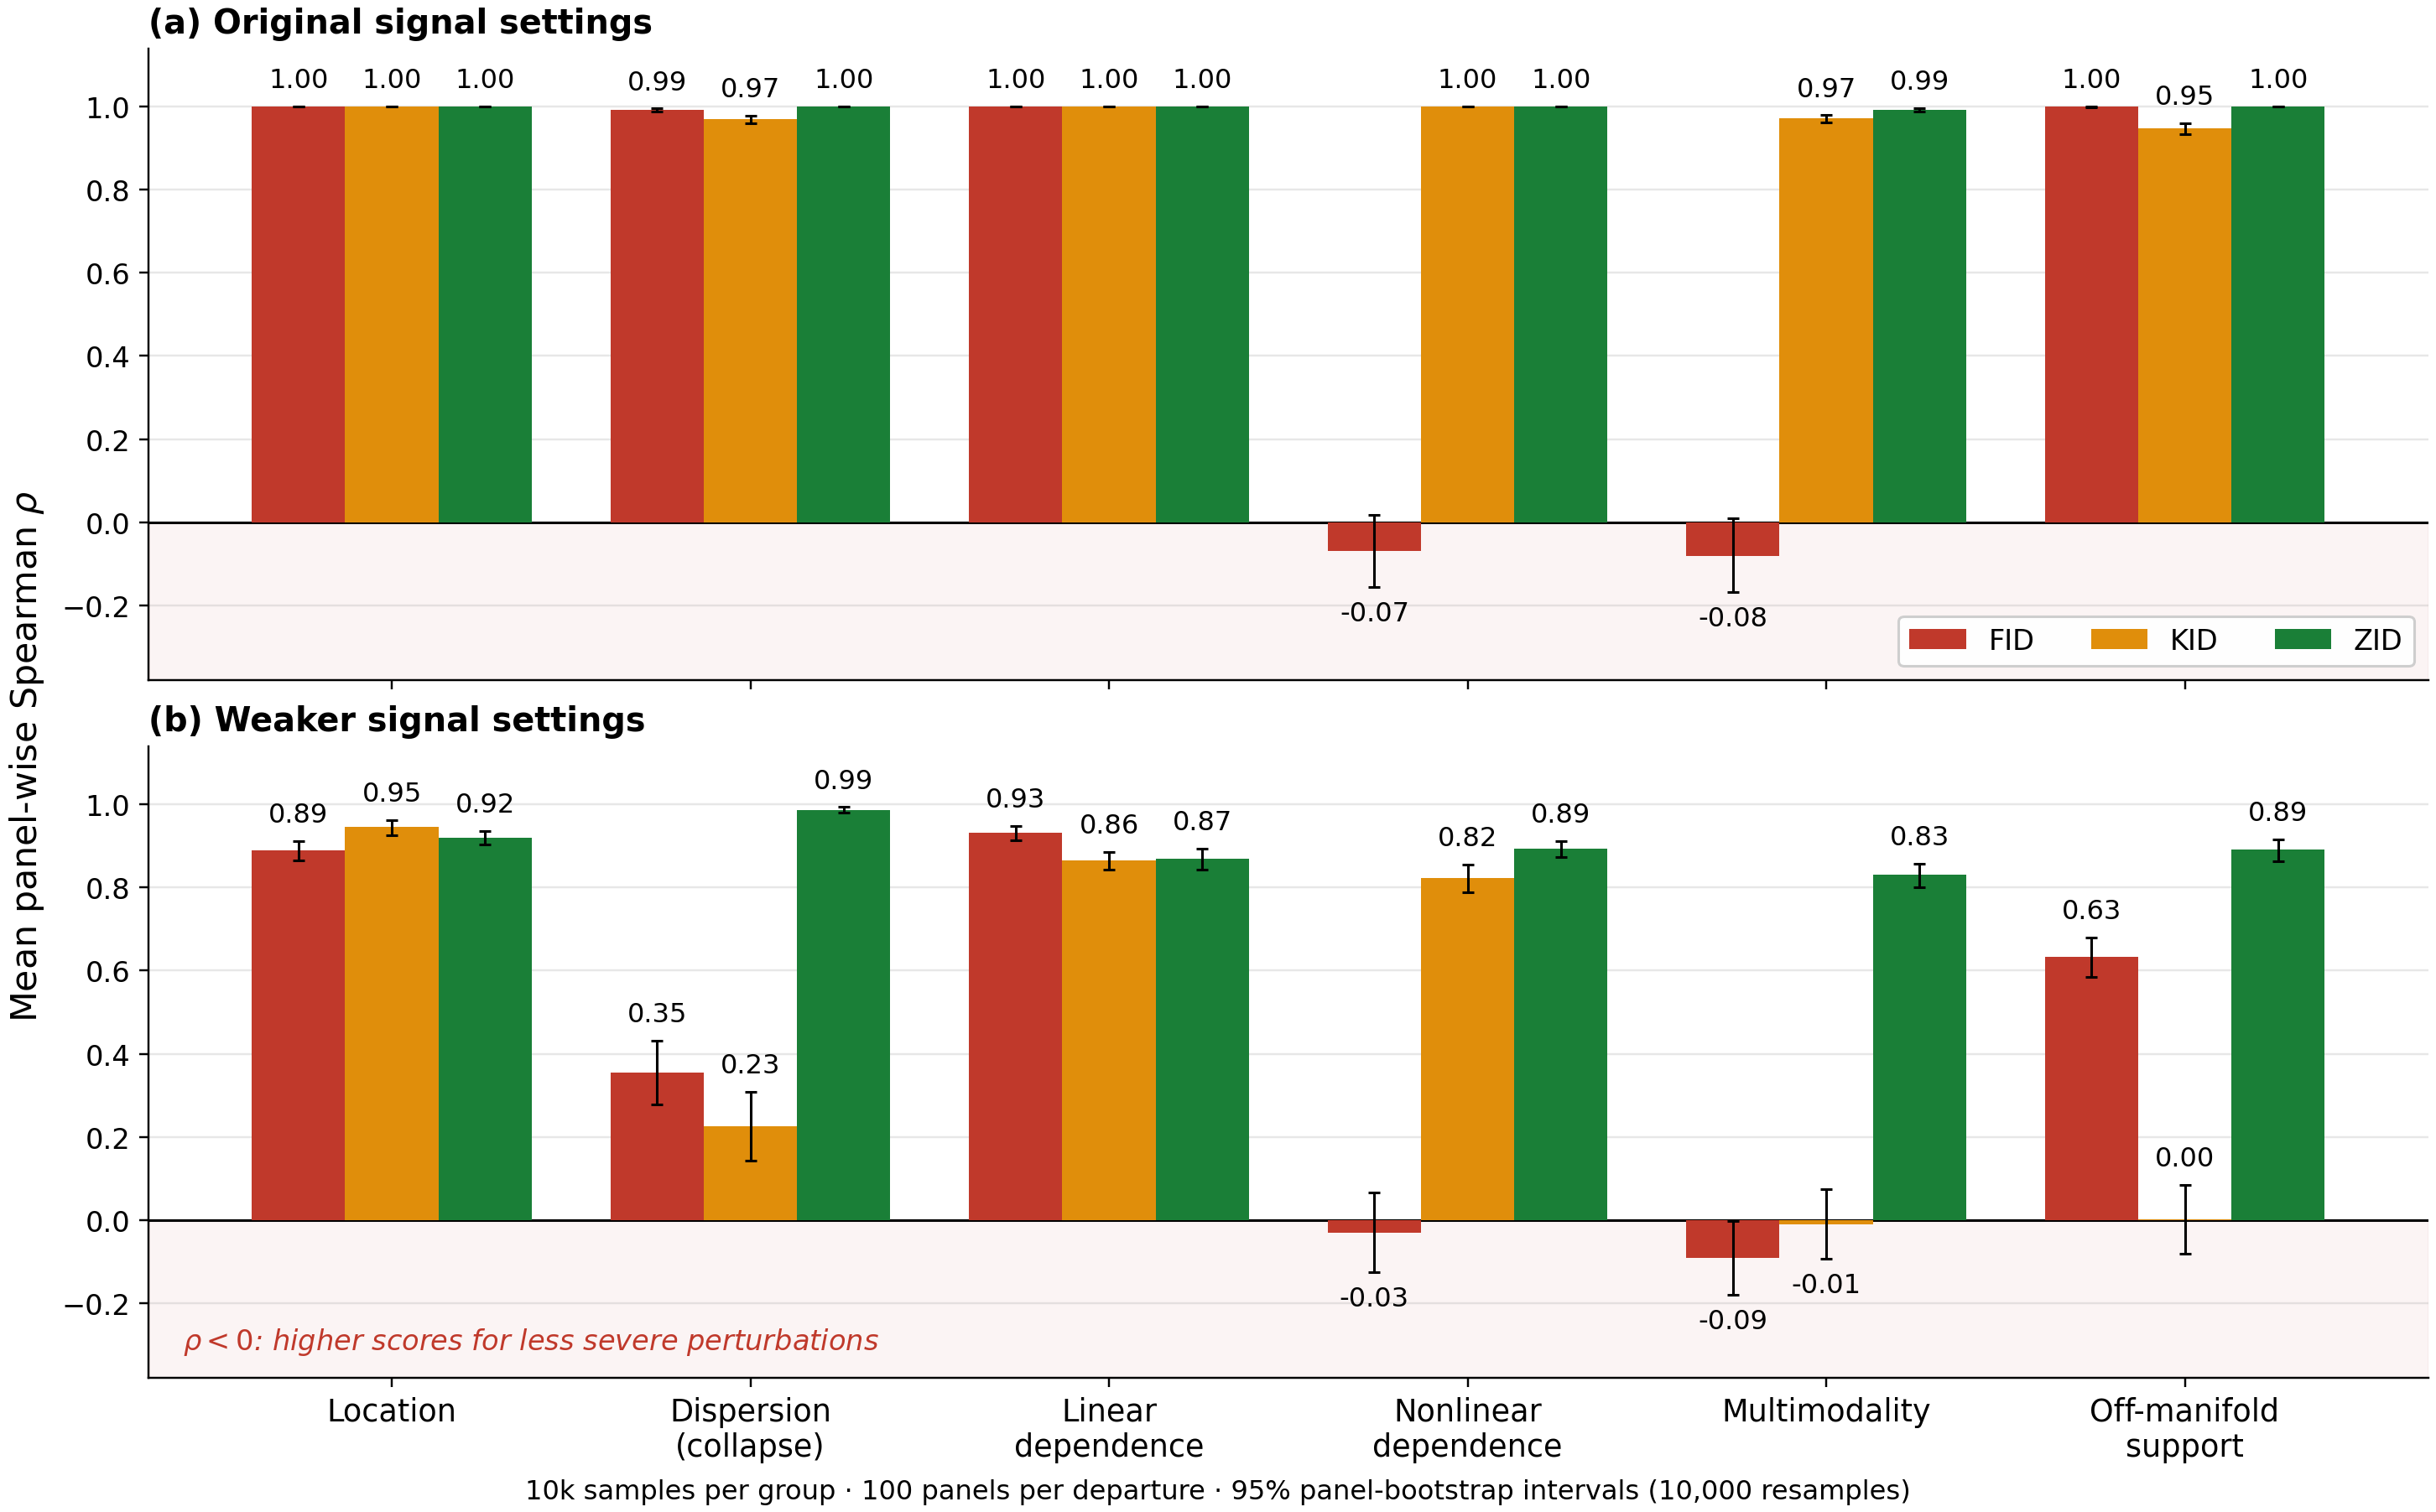
Bars show the mean panel-wise Spearman correlation across 100 panels per departure, each with six ordered severities and 10,000 samples per group. Error bars are pointwise 95% panel-bootstrap intervals based on 10,000 resamples. A negative correlation means that higher scores are assigned to less severe perturbations.